The Economics of Running an Upwork Agency: Understanding Your True Unit Economics
Master the financial fundamentals that separate profitable agencies from those that struggle. The complete guide to agency economics and profitability.

Most agency owners are terrible at understanding their true economics. They celebrate revenue milestones while their profit margins shrink. They add team members without calculating the real cost. They price services based on competition instead of value. This financial blindness kills more agencies than any other factor.
After analyzing the financial data from 300+ agencies, I've identified the key economic principles that separate sustainably profitable agencies from those that struggle despite high revenue. This isn't about accounting—it's about understanding the fundamental economics that drive long-term success.
The Agency Economics Foundation
Understanding Unit Economics
Unit economics answers the fundamental question: How much money do you make per client, per project, per hour, and per team member?
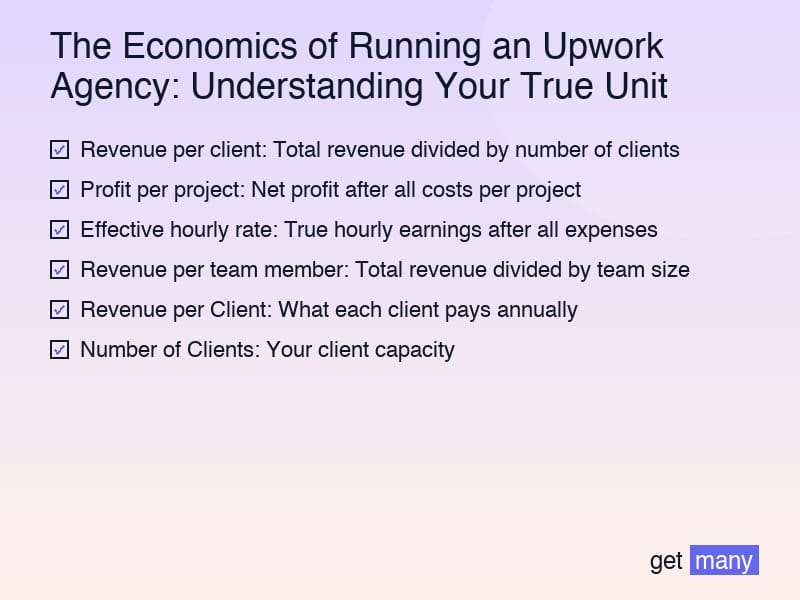
Key unit economic metrics:
- Revenue per client: Total revenue divided by number of clients
- Profit per project: Net profit after all costs per project
- Effective hourly rate: True hourly earnings after all expenses
- Revenue per team member: Total revenue divided by team size
The Agency Profit Equation
Agency Profit = (Revenue per Client × Number of Clients) - (Fixed Costs + Variable Costs)
Breaking this down:
- Revenue per Client: What each client pays annually
- Number of Clients: Your client capacity
- Fixed Costs: Overhead that doesn't change with client volume
- Variable Costs: Expenses that scale with client work
The Hidden Costs Most Agencies Miss
Administrative time: Proposal writing, communication, project management Context switching: Lost productivity from juggling multiple projects Quality control: Review, revision, and rework time Business development: Sales, marketing, and relationship building Learning curve: Time spent training and onboarding
The True Cost of Client Acquisition
Client Acquisition Cost (CAC) Calculation
CAC = Total Sales & Marketing Costs / Number of New Clients Acquired
Components of CAC:
- Direct costs: Advertising, Upwork fees, tools
- Time costs: Proposal writing, pitching, relationship building
- Opportunity costs: Revenue lost during acquisition activities
- Overhead allocation: Portion of fixed costs attributable to sales
The CAC Payback Period
How long does it take to recover client acquisition costs?
Formula: CAC / Monthly Revenue per Client = Payback Period in Months
Example:
- CAC: $2,000
- Monthly revenue per client: $4,000
- Payback period: 0.5 months
Benchmark: Healthy agencies recover CAC within 3-6 months
Lifetime Value (LTV) to CAC Ratio
LTV:CAC ratio measures the return on acquisition investment
LTV = Average Monthly Revenue per Client × Average Client Retention (months)
Healthy ratios:
- 3:1 minimum: Sustainable but not optimal
- 5:1 ideal: Strong profitability and growth potential
- 8:1+ exceptional: Premium positioning and excellent retention
The Team Economics Model
The True Cost of Team Members
Beyond salary considerations:
Direct costs:
- Salary or contractor fees
- Benefits and payroll taxes
- Equipment and software licenses
- Training and development
Indirect costs:
- Management time and overhead
- Communication and coordination
- Quality control and review
- Administrative support
Opportunity costs:
- Your time spent managing vs. selling
- Potential productivity loss during onboarding
- Capacity constraints during training
Revenue per Team Member Analysis
Calculate productivity and profitability:
Formula: Total Agency Revenue / Number of Team Members
Industry benchmarks:
- Struggling agencies: $60k-$100k per team member
- Healthy agencies: $150k-$250k per team member
- Exceptional agencies: $300k+ per team member
The Team Scalability Equation
When does adding team members increase profitability?
New team member is profitable when: Revenue Generated by New Hire > (Salary + Benefits + Overhead + Management Time)
Key factors:
- Utilization rate of new hire
- Billing rate vs. cost rate
- Management bandwidth available
- Training and ramp-up time
Pricing Strategy and Economics
Cost-Plus vs. Value-Based Pricing
Cost-plus pricing:
- Calculate all costs and add desired margin
- Predictable but limits profitability
- Suitable for commodity services
Value-based pricing:
- Price based on client value received
- Higher margins but requires positioning
- Ideal for strategic services
The Pricing Psychology
Client's economic decision: ROI from your service > Cost of your service
Your pricing power comes from:
- Unique expertise or positioning
- Proven results and case studies
- Scarcity and demand
- Relationship depth and trust
Dynamic Pricing Strategies
Adjust pricing based on:
- Client size and budget
- Project complexity and risk
- Timeline and urgency
- Market demand and competition
- Your capacity and availability
The Cash Flow Management System
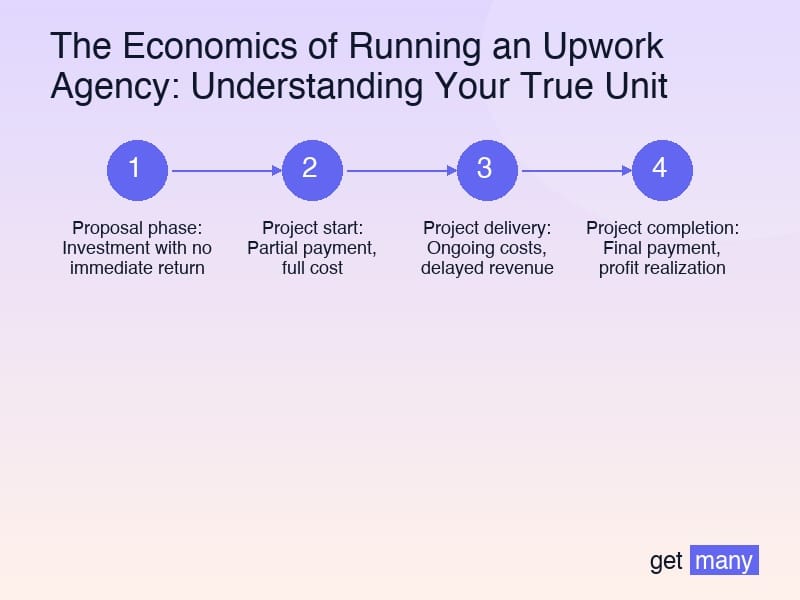
The Agency Cash Flow Cycle
Understanding cash flow timing:
- Proposal phase: Investment with no immediate return
- Project start: Partial payment, full cost commitment
- Project delivery: Ongoing costs, delayed revenue
- Project completion: Final payment, profit realization
Cash Flow Optimization Strategies
Improve cash flow through:
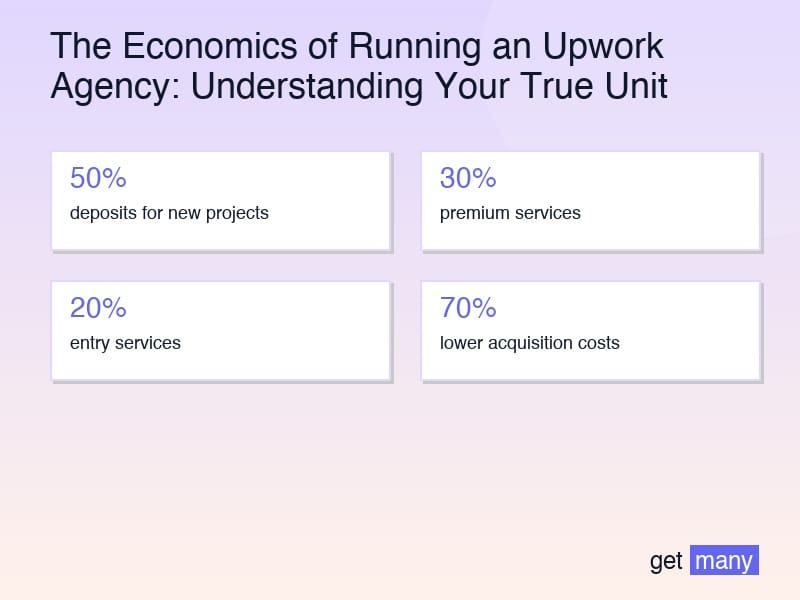
- Upfront payments: 50% deposits for new projects
- Milestone billing: Regular payments throughout projects
- Retainer agreements: Monthly recurring revenue
- Faster collections: Net 15 instead of Net 30 terms
The Cash Flow Cushion
Maintain cash reserves for:
- 3-6 months of operating expenses
- Seasonal revenue fluctuations
- Unexpected client losses
- Growth investment opportunities
Profitability Analysis by Service Line
Service Profitability Matrix
Analyze each service for:
- Revenue potential: Maximum revenue per project
- Profit margins: Net profit after all costs
- Scalability: Ability to increase capacity
- Market demand: Client need and willingness to pay
High-Margin vs. High-Volume Services
High-margin services:
- Strategic consulting
- Specialized expertise
- Complex problem-solving
- Custom solutions
High-volume services:
- Standardized deliverables
- Repeatable processes
- Scalable systems
- Commoditized work
The Service Portfolio Optimization
Ideal service mix:
- 30% premium services: High margin, strategic value
- 50% core services: Balanced margin and volume
- 20% entry services: Lead generation and relationship building
The Economics of Specialization
Niche Market Economics
Benefits of specialization:
- Higher pricing power: Expertise commands premium
- Lower acquisition costs: Referrals and reputation
- Increased efficiency: Repeatable processes
- Better client relationships: Deep understanding
The Specialization ROI
Specialization typically results in:
- 20-50% higher pricing
- 30-70% lower acquisition costs
- 15-25% higher profit margins
- 40-80% better client retention
Geographic and Industry Focus
Economic advantages:
- Geographic focus: Local market knowledge, relationship networks
- Industry focus: Deep expertise, specialized processes
- Service focus: Operational efficiency, premium positioning
Technology Investment and ROI
Technology as a Profit Center
Technology investments should:
- Reduce operational costs: Automation and efficiency
- Increase revenue per client: Better service delivery
- Improve client satisfaction: Enhanced experience
- Enable scalability: Handle more clients with same team
The Technology ROI Calculation
ROI = (Cost Savings + Revenue Increases) / Technology Investment
Example:
- Technology investment: $10,000
- Annual cost savings: $15,000
- Annual revenue increase: $25,000
- ROI: 300%
The Getmany Economic Impact
Getmany's economic benefits:
- Reduced acquisition costs: Automated proposal generation
- Increased win rates: Better proposal quality
- Time savings: 20+ hours per month freed up
- Revenue growth: More opportunities pursued
Typical ROI: 500-1000% within first year
Economic Scenario Planning
Best Case Scenario Modeling
Plan for success:
- Revenue growth projections
- Team expansion requirements
- Technology investment needs
- Market expansion opportunities
Worst Case Scenario Preparation
Plan for challenges:
- Client loss impact analysis
- Revenue decline responses
- Cost reduction strategies
- Cash flow management
The Economic Stress Test
Questions to ask:
- What happens if we lose our biggest client?
- How long can we operate without new business?
- What's our minimum viable revenue?
- Which costs can we cut quickly?
Key Performance Indicators (KPIs)
Financial KPIs
Revenue metrics:
- Monthly recurring revenue (MRR)
- Revenue growth rate
- Revenue per client
- Revenue per team member
Profitability metrics:
- Gross profit margin
- Net profit margin
- Client profitability
- Project profitability
Operational KPIs
Efficiency metrics:
- Utilization rates
- Project completion time
- Quality metrics
- Client satisfaction scores
Growth metrics:
- Client acquisition rate
- Client retention rate
- Average project value
- Market share
Industry Benchmarks and Comparisons
Agency Performance Benchmarks
Revenue growth:
- Struggling agencies: 0-10% annual growth
- Healthy agencies: 15-30% annual growth
- High-growth agencies: 40%+ annual growth
Profit margins:
- Struggling agencies: 5-15% net margin
- Healthy agencies: 20-35% net margin
- Exceptional agencies: 40%+ net margin
Competitive Analysis
Compare your agency on:
- Pricing strategies
- Service offerings
- Client satisfaction
- Market positioning
- Growth trajectories
Financial Planning and Forecasting
The 12-Month Financial Plan
Monthly planning includes:
- Revenue projections
- Cost budgets
- Cash flow forecasts
- Profitability targets
The Growth Investment Strategy
Reinvestment priorities:
- Team expansion
- Technology upgrades
- Marketing and sales
- Process improvements
Exit Strategy Economics
Building value for:
- Future sale preparation
- Investor attraction
- Succession planning
- Wealth building
Your Economic Optimization Action Plan
Month 1: Economic Assessment
- Calculate current unit economics
- Analyze client profitability
- Assess team productivity
- Review pricing strategies
Month 2: Cost Optimization
- Identify cost reduction opportunities
- Negotiate better vendor terms
- Optimize operational efficiency
- Implement financial controls
Month 3: Revenue Enhancement
- Optimize pricing strategies
- Improve service mix
- Increase client lifetime value
- Expand service offerings
Month 4-6: Strategic Implementation
- Execute optimization strategies
- Monitor performance metrics
- Adjust based on results
- Plan for sustainable growth
The Bottom Line
Understanding your agency's economics isn't optional—it's essential for sustainable growth and profitability. The agencies that master their unit economics make better decisions, grow more profitably, and build more valuable businesses.
Focus on the metrics that matter: client lifetime value, acquisition costs, team productivity, and profit margins. Use this data to make informed decisions about pricing, hiring, and growth strategies.
Remember: Revenue is vanity, profit is sanity, and cash flow is reality. Build your agency on solid economic foundations, and you'll create a business that thrives in any market condition.
The economics of your agency determine its long-term success. Invest the time to understand and optimize them, and you'll build a sustainably profitable business that serves you and your clients for years to come.
Ready to optimize your agency's economics? Getmany can help you reduce acquisition costs and increase win rates, directly improving your unit economics. Start building a more profitable agency today.